
GTA Real Estate Market Update: October 2026 (TRREB)

TRREB released its October 2026 Market Watch on November 4, so here is my full read on the Greater Toronto Area (GTA) market, from the City of Toronto (the 416) to York, Peel, Durham, Halton, Dufferin and Simcoe. The short version: buyers stayed cautious, with 5,603 sales, down 7.9% from last October, but new listings fell even faster (down 11.9%), so the market did not get any looser. Prices are still below last year, yet both prices and sales edged up from September on a seasonally adjusted basis.
Below you will find the headline numbers, the MLS® Home Price Index, the 416 vs 905 split, a region-by-region look, detached, semi, townhouse and condo trends, a rates snapshot, and what it all means if you are buying or selling this winter.

GTA headline numbers: October 2026
The GTA had a quiet October: fewer sales and fewer new listings than a year ago, with prices modestly lower. These are TRREB's all-area figures, compared with October 2025 (TRREB's own revised year-ago base) and with September 2026:
Sales: 5,603, down 7.9% from 6,083 in October 2025, and up 11.2% from 5,040 in September 2026.
New listings: 14,173, down 11.9% from 16,080 a year ago, and down 14.1% from 16,500 in September.
Active listings: 25,098, down 10.0% from 27,899 a year ago, and down 4.0% from 26,131 in September.
Average price: $1,024,108, down 2.7% from $1,052,539 a year ago, and up 1.8% from $1,006,409 in September.
Median price: $860,000, down 4.4% from $900,000 in October 2025 (as published), and flat versus September's $860,000.
Seasonally adjusted: TRREB reports that October sales and new listings were up month over month versus September, and that the MLS® HPI Composite and average price edged up month over month.

TRREB's own framing is worth repeating: uncertainty about inflation, borrowing costs and the economy kept many buyers on the sidelines, but lower selling prices have kept monthly payments for an average-priced home well below what buyers faced in 2023 and 2024, even though payments have edged up from a year ago.

Sale-to-list ratio, days on market and inventory
Outside the raw counts, the balance indicators say the same thing: a market where buyers have room to negotiate, but where good homes still sell in about a month. GTA-wide, October 2026 vs October 2025 and September 2026 (TRREB, all home types):
Average sale-to-list price ratio: 97%, versus 98% a year ago and 98% in September.
Average days on market (LDOM): 31 days, the same as last October (31) and down from 34 in September. Average PDOM: 49 days vs 50 a year ago and 51 in September.
Months of inventory: 4.6, versus 4.7 a year ago and 4.6 in September.
Sales-to-new-listings ratio: 37.9%, up from 34.1% a year ago and in line with 37.8% in September. That is because new listings fell faster than sales.
Months of inventory in the 4 to 5 range, with a sales-to-new-listings ratio near 38%, is a balanced-to-buyer-leaning market. I will point out below where it is tighter (Durham, parts of Toronto East) and looser (King, Innisfil, Caledon).
MLS® Home Price Index: benchmark prices by home type
The MLS® Home Price Index (HPI) tracks the price of a typical home with fixed characteristics, so it is less affected by the mix of homes that happen to sell in a month. The MLS® HPI Composite benchmark was $916,400 in October, down 4.3% from a year ago, and slightly below September's $917,600 before seasonal adjustment (TRREB says the seasonally adjusted Composite edged up month over month). All TRREB areas, October 2026:
Composite: $916,400, down 4.28% year over year (September 2026: $917,600).
Detached: $1,194,200, down 4.44% (September: $1,196,400).
Single-family attached: $914,300, down 3.83% (September: $912,000).
Townhouse: $662,200, down 6.64% (September: $668,800).
Apartment: $521,600, down 7.33% (September: $527,200).

Every category was lower than a year ago, and apartments and townhouses fell the most. Detached and attached homes held up better.
416 vs 905: City of Toronto vs the rest of the GTA
The 416 is the City of Toronto. The 905 is everything else in TRREB's area (Durham, York, Peel, Halton, Dufferin and Simcoe). Toronto's average price was roughly 8.5% higher than the 905's, and it edged up year over year while the 905's average fell. TRREB's headline home-type table shows this clearly:
Detached: 741 sales in the 416 (average $1,603,886) vs 1,952 in the 905 (average $1,199,303). Sales were up 0.5% in the 416 and down 6.2% in the 905. Average price: down 1.2% in the 416, down 4.7% in the 905.
Semi-detached: 266 vs 280 sales (average $1,225,229 vs $834,602). Sales were up 1.5% in the 416 and down 15.7% in the 905. Average price: up 0.5% in the 416, down 5.9% in the 905.
Townhouse (TRREB's headline category, attached plus condo townhouse): 217 vs 716 sales (average $927,804 vs $767,021). Sales were down 13.2% in the 416 and 10.3% in the 905. Average price: up 4.2% in the 416, down 7.9% in the 905.
Condo apartment: 949 vs 436 sales (average $659,214 vs $539,094). Sales were down 10.7% in the 416 and 9.7% in the 905. Average price: down 5.6% in the 416, down 6.1% in the 905.
Using TRREB's regional tables, my own roll-up of the two sides (all home types) looks like this for October 2026:
416 (City of Toronto): 2,184 sales, average $1,075,627, median $835,000, 5,451 new listings, 9,526 active listings, 4.6 months of inventory.
905 (all other TRREB areas): 3,419 sales, average about $991,198 (down 5.1% vs a year ago), 8,722 new listings, 15,572 active listings. (Calculated by me as the GTA total minus the City of Toronto, so there is no TRREB median for it.)

The takeaway: the 905 saw the steeper drops in both sales and price, especially for semis and townhouses, while detached and semi-detached homes in the 416 were roughly flat on price. Condo apartments were the weak spot everywhere.
Region by region: Toronto, York, Peel, Durham, Halton, Dufferin and Simcoe
TRREB publishes a full table for each region. In every case below, October 2026 is compared with October 2025 using the October 2025 Market Watch as originally published, plus September 2026 for the month-over-month view. Small samples are flagged because a handful of sales can swing an average.


City of Toronto (the 416)
Toronto was the most resilient part of the GTA on price. Sales were softer than a year ago, but the average price edged up and the median was only slightly lower, helped by a strong showing from Toronto Central.
Sales: 2,184, down 7.1% from 2,351 a year ago and up 12.8% from 1,937 in September.
Prices: average $1,075,627 (up 0.5% y/y), median $835,000 (down 1.2% from $845,000 a year ago; September: $810,000).
Supply: 5,451 new listings (down 9.0% y/y) and 9,526 active listings (down 8.0% y/y).
Balance: 38.6% sales-to-new-listings (34.5% a year ago), 4.6 months of inventory (4.8 a year ago), 98% sale-to-list, 30 average days on market (31 a year ago).
MLS® HPI benchmark (October 2026): Composite $908,800 (down 3.60% y/y), detached $1,422,800 (down 3.82%), apartment $540,100 (down 6.97%).
Toronto West: 570 sales (down 8.7% y/y), median $856,750 (down 4.8%), 4.4 months of inventory.
Toronto Central: 1,089 sales (up 1.3% y/y), median $765,000 (up 0.7%), average $1,185,407 (up 4.4%), 5.1 months of inventory.
Toronto East: 525 sales (down 19.5% y/y), median $875,000 (down 1.0%), 3.7 months of inventory, 101% sale-to-list. It is the tightest part of the city.
By home type in the City of Toronto:
Detached: 741 sales (vs 747 a year ago), average $1,603,886 (down 0.9% y/y), median $1,260,000.
Semi-detached: 266 sales (vs 263 a year ago), average $1,225,229 (up 0.5% y/y), median $1,125,748.
Townhouse (attached/row): 80 sales (vs 86 a year ago), average $1,244,686 (up 10.9% y/y), median $1,110,000.
Condo apartment: 949 sales (vs 1,072 a year ago), average $659,214 (down 5.7% y/y), median $545,000.
York Region

York was the busiest 905 region by sales and held steady on volume, but prices are lower than a year ago. Sales were almost flat, while the average price fell, with King (11.1 months of inventory) and Georgina (6.4) the loosest municipalities.
Sales: 1,038, down 1.1% from 1,050 a year ago and up 16.2% from 893 in September.
Prices: average $1,142,789 (down 7.5% y/y), median $1,050,000 (down 6.2% from $1,120,000 a year ago; September: $1,043,000).
Supply: 2,663 new listings (down 12.0% y/y) and 4,932 active listings (down 10.1% y/y).
Balance: 36.2% sales-to-new-listings (32.6% a year ago), 5.0 months of inventory (5.1 a year ago), 97% sale-to-list, 33 average days on market (32 a year ago).
MLS® HPI benchmark (October 2026): Composite $1,071,700 (down 6.76% y/y), detached $1,320,700 (down 6.53%), apartment $502,800 (down 9.32%).
Municipality snapshot (October 2026):
Markham: 260 sales, median $1,050,000, 4.1 months of inventory.
Vaughan: 263 sales, median $1,135,000, 4.8 months of inventory.
Richmond Hill: 185 sales, median $1,150,000, 5.5 months of inventory.
Aurora: 50 sales, median $1,131,500, 5.0 months of inventory.
Newmarket: 98 sales, median $875,000, 4.1 months of inventory.
Whitchurch-Stouffville: 52 sales, median $1,036,940, 5.3 months of inventory.
Georgina: 71 sales, median $740,000, 6.4 months of inventory.
King: 28 sales, median $1,577,500, 11.1 months of inventory.
East Gwillimbury: 31 sales, median $993,000, 5.3 months of inventory.
By home type in York Region:
Detached: 596 sales (vs 583 a year ago), average $1,413,877 (down 7.7% y/y), median $1,271,500.
Semi-detached: 69 sales (vs 63 a year ago), average $936,170 (down 8.9% y/y), median $925,000.
Townhouse (attached/row): 148 sales (vs 161 a year ago), average $961,875 (down 8.3% y/y), median $955,944.
Condo apartment: 163 sales (vs 172 a year ago), average $549,951 (down 11.1% y/y), median $515,000.
Peel Region (Mississauga, Brampton, Caledon)

Peel saw both prices and sales fall, with a balanced market overall. Mississauga and Brampton are the volume drivers, while Caledon has the most inventory.
Sales: 1,017, down 7.3% from 1,097 a year ago and up 8.7% from 936 in September.
Prices: average $898,431 (down 6.9% y/y), median $831,000 (down 6.5% from $888,888 a year ago; September: $855,000).
Supply: 2,462 new listings (down 15.4% y/y) and 4,368 active listings (down 15.6% y/y).
Balance: 35.9% sales-to-new-listings (30.7% a year ago), 4.9 months of inventory (5.2 a year ago), 97% sale-to-list, 33 average days on market (31 a year ago).
MLS® HPI benchmark (October 2026): Composite $858,800 (down 4.63% y/y), detached $1,101,300 (down 5.21%), apartment $469,600 (down 8.96%).
Municipality snapshot (October 2026):
Mississauga: 508 sales, median $843,000, 4.9 months of inventory.
Brampton: 435 sales, median $800,000, 4.6 months of inventory.
Caledon: 74 sales, median $982,500, 6.5 months of inventory.
By home type in Peel:
Detached: 504 sales (vs 549 a year ago), average $1,126,231 (down 6.6% y/y), median $1,035,000.
Semi-detached: 153 sales (vs 161 a year ago), average $826,306 (down 4.5% y/y), median $820,000.
Townhouse (attached/row): 81 sales (vs 106 a year ago), average $769,571 (down 5.4% y/y), median $752,000.
Condo apartment: 152 sales (vs 159 a year ago), average $485,658 (down 7.1% y/y), median $439,200.
Durham Region

Durham had the biggest drop in sales among the five largest regions, but it is also the tightest of them, with just 3.6 months of inventory and a sales-to-new-listings ratio above 40%. That is a sign that supply is also thin.
Sales: 589, down 17.6% from 715 a year ago and up 6.7% from 552 in September.
Prices: average $793,024 (down 6.9% y/y), median $740,000 (down 7.6% from $801,000 a year ago; September: $770,000).
Supply: 1,700 new listings (down 5.1% y/y) and 2,619 active listings (up 1.9% y/y).
Balance: 40.6% sales-to-new-listings (40.1% a year ago), 3.6 months of inventory (3.2 a year ago), 98% sale-to-list, 29 average days on market (29 a year ago).
MLS® HPI benchmark (October 2026): Composite $798,100 (down 5.11% y/y), detached $875,700 (down 5.07%), apartment $460,600 (down 4.61%).
Municipality snapshot (October 2026):
Oshawa: 152 sales, median $623,750, 3.7 months of inventory.
Whitby: 108 sales, median $852,500, 3.0 months of inventory.
Ajax: 74 sales, median $812,750, 3.1 months of inventory.
Pickering: 93 sales, median $784,990, 3.8 months of inventory.
Clarington: 111 sales, median $680,000, 3.2 months of inventory.
Scugog: 27 sales, median $880,000, 5.4 months of inventory.
Uxbridge: 11 sales, median $1,035,000, 5.4 months of inventory (small sample).
Brock: 13 sales, median $620,000, 7.2 months of inventory (small sample).
By home type in Durham:
Detached: 407 sales (vs 459 a year ago), average $875,260 (down 8.0% y/y), median $820,000.
Semi-detached: 23 sales (vs 45 a year ago), average $617,652 (down 14.4% y/y), median $615,000.
Townhouse (attached/row): 75 sales (vs 95 a year ago), average $694,156 (down 8.4% y/y), median $690,000.
Condo apartment: 33 sales (vs 51 a year ago), average $466,698 (down 7.3% y/y), median $470,000.
Halton Region (Oakville, Burlington, Milton, Halton Hills)

Halton's average price was flat year over year, the best result in the 905, though sales dropped and the median is lower. Oakville remains the premium market, and Burlington has the tightest inventory.
Sales: 592, down 14.7% from 694 a year ago and up 17.9% from 502 in September.
Prices: average $1,138,684 (up 0.1% y/y), median $953,750 (down 4.6% from $999,450 a year ago; September: $982,500).
Supply: 1,361 new listings (down 17.7% y/y) and 2,485 active listings (down 13.1% y/y).
Balance: 40.5% sales-to-new-listings (36.3% a year ago), 4.2 months of inventory (4.3 a year ago), 96% sale-to-list, 34 average days on market (34 a year ago).
MLS® HPI benchmark (October 2026): Composite $966,000 (down 1.08% y/y), detached $1,327,100 (down 0.95%), apartment $509,300 (down 6.57%).
Municipality snapshot (October 2026):
Oakville: 191 sales, median $1,220,000, 4.9 months of inventory.
Burlington: 214 sales, median $892,000, 3.6 months of inventory.
Milton: 128 sales, median $888,500, 3.9 months of inventory.
Halton Hills: 59 sales, median $960,000, 4.2 months of inventory.
By home type in Halton:
Detached: 312 sales (vs 362 a year ago), average $1,473,177 (up 3.1% y/y), median $1,289,500.
Semi-detached: 25 sales (vs 48 a year ago), average $867,720 (down 13.0% y/y), median $862,000.
Townhouse (attached/row): 99 sales (vs 104 a year ago), average $870,512 (down 9.2% y/y), median $860,000.
Condo apartment: 83 sales (vs 98 a year ago), average $647,687 (up 4.0% y/y), median $532,500.
Dufferin County (Orangeville)

TRREB's Dufferin County area is Orangeville only, so the sample is small. With 26 sales, treat any percentage here as a rough signal, not a trend.
Sales: 26, down 21.2% from 33 a year ago and down 21.2% from 33 in September.
Prices: average $717,319 (down 2.9% y/y), median $715,000 (up 0.7% from $710,000 a year ago; September: $740,000).
Supply: 54 new listings (down 32.5% y/y) and 130 active listings (down 5.8% y/y).
Balance: 41.0% sales-to-new-listings (41.4% a year ago), 4.6 months of inventory (3.9 a year ago), 97% sale-to-list, 40 average days on market (38 a year ago).
MLS® HPI benchmark (October 2026): Composite $721,100 (up 0.40% y/y), detached $853,900 (up 0.42%), apartment $371,500 (down 9.69%).
By home type in Dufferin:
Detached: 13 sales (vs 17 a year ago), average $852,308 (up 1.6% y/y), median $870,000 (small sample).
Semi-detached: 3 sales (vs 7 a year ago), average $537,967 (down 17.9% y/y), median $540,000 (small sample).
Townhouse (attached/row): 7 sales (vs 7 a year ago), average $622,500 (down 3.8% y/y), median $615,000 (small sample).
Condo apartment: 3 sales (vs 0 a year ago), average $532,967 (n/a y/y), median $538,900 (small sample).
Simcoe County (TRREB area)

TRREB's Simcoe County area covers Bradford West Gwillimbury, Innisfil, New Tecumseth, Essa and Adjala-Tosorontio, not Barrie or Orillia. It had the loosest market of the major regions, with 5.9 months of inventory and a lower average price than a year ago. For my full town-by-town read, including Barrie and Orillia, see my Simcoe County market update for October 2026.
Sales: 157, down 20.7% from 198 a year ago and down 16.0% from 187 in September.
Prices: average $822,574 (down 8.8% y/y), median $775,000 (down 3.1% from $800,000 a year ago; September: $762,500).
Supply: 482 new listings (down 21.9% y/y) and 1,038 active listings (down 15.1% y/y).
Balance: 33.9% sales-to-new-listings (29.4% a year ago), 5.9 months of inventory (6.1 a year ago), 96% sale-to-list, 37 average days on market (39 a year ago).
MLS® HPI benchmark (October 2026): Composite $772,800 (down 6.41% y/y), detached $804,300 (down 6.91%), apartment $465,900 (down 15.29%).
Municipality snapshot (October 2026):
Innisfil: 40 sales, median $756,000, 7.4 months of inventory.
Bradford West Gwillimbury: 34 sales, median $840,500, 4.6 months of inventory.
New Tecumseth: 54 sales, median $747,500, 5.1 months of inventory.
Essa: 19 sales, median $755,000, 4.9 months of inventory (small sample).
By home type in Simcoe County (several categories are small samples):
Detached: 120 sales (vs 139 a year ago), average $865,052 (down 13.2% y/y), median $816,495.
Semi-detached: 7 sales (vs 8 a year ago), average $736,429 (up 7.6% y/y), median $740,000 (small sample).
Townhouse (attached/row): 18 sales (vs 25 a year ago), average $726,016 (down 0.9% y/y), median $693,450 (small sample).
Condo apartment: 2 sales (vs 6 a year ago), average $412,500 (down 13.2% y/y), median $412,500 (small sample).
By home type: detached, semi-detached, townhouse and condo
TRREB's home-type tables show where the pressure is. Detached and semi-detached homes held their value best; condo apartments and townhouses saw the largest declines. GTA-wide, October 2026:

Detached homes

Sales: 2,693, down 4.4% y/y (TRREB), about 48.1% of all sales. September 2026: 2,399.
Average price: $1,310,627, down 3.2% y/y (TRREB), up 1.4% from September's $1,292,016. Median price: $1,110,000, down 4.7% vs a year ago.
Balance: 97% sale-to-list and 29 average days on market (TRREB regional tables, all areas).
Semi-detached homes
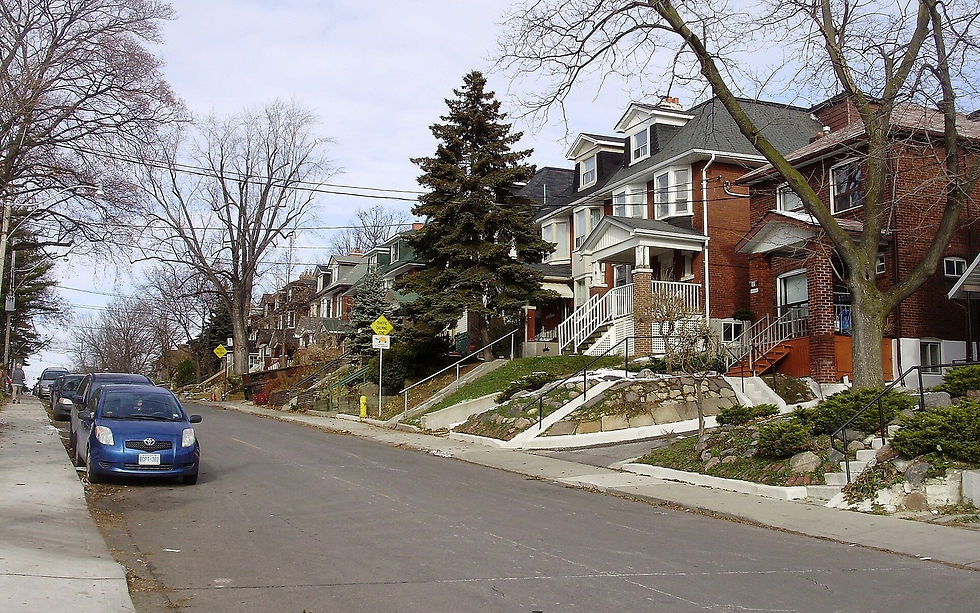
Sales: 546, down 8.1% y/y (TRREB), about 9.7% of all sales. September 2026: 459.
Average price: $1,024,907, down 0.8% y/y (TRREB). Median price: $907,000, down 2.2% vs a year ago.
Balance: 101% sale-to-list and 22 average days on market. This is the fastest-moving category in the GTA, and semis in Toronto sold at 102% of list on average.
Townhouses

Sales (TRREB headline townhouse category, attached/row plus condo townhouse): 933, down 11.0% y/y, with an average price of $804,416, down 5.0% (TRREB).
Attached/row only (regional tables): 508 sales (vs 584 a year ago), average $905,385 (down 3.2% y/y), median $830,000, 99% sale-to-list, 28 average days on market.
Where it was strongest: townhouse prices were up in the City of Toronto (average up 4.2% in TRREB's headline table), while the 905 saw an average decline of 7.9%.
Condo apartments

Sales: 1,385, down 10.4% y/y (TRREB), about 24.7% of all sales. September 2026: 1,316.
Average price: $621,400, down 5.8% y/y (TRREB). Median price: $528,000, down 6.5% vs a year ago.
Balance: 8,100 active listings against 1,385 sales this month, 97% sale-to-list and 38 average days on market, the slowest of any home type.
Condo apartments are where buyers hold the most leverage right now. In the City of Toronto alone there were 5,251 active condo apartment listings against 949 sales, an average of 36 days on market, and homes sold for 97% of list on average.
Rates and the economy

Borrowing costs are a big part of why buyers hesitated. TRREB's indicators panel (Bank of Canada and Statistics Canada data) shows:
Bank of Canada overnight rate: 2.5% in October, up from 2.3% in September (as printed by TRREB). Prime rate: 4.5%, unchanged.
Average mortgage rates, October 2026: 1-year 5.49% (unchanged from September), 3-year 6.05% (unchanged), 5-year 6.19% (up from 6.09%).
Inflation: 3.1% year over year in September. Toronto unemployment rate: 6.9% (September, seasonally adjusted). Toronto employment growth: 2.1% year over year (September). Real GDP growth: 3.3% annualized in Q2 2026.

TRREB says a Canada-U.S. trade deal, together with a resolution to the conflict in the Middle East, could help ease inflation worries and renew buyer confidence heading into 2027. It also points to HST rebates and development charge reductions as policies that should bring more ownership and rental supply to market over the medium term, since the GTA's population is still growing.
What it means for buyers
You still have negotiating power. GTA homes sold at 97% of list on average, with 4.6 months of inventory. The tightest pockets are Durham (3.6 months of inventory) and Toronto East (3.7), where homes sold for 101% of list on average.
Condos offer the most choice. There are 8,100 active condo apartment listings across the GTA against 1,385 sales, and prices are down about 6% from a year ago.
Payments are manageable relative to 2023 and 2024. TRREB notes that lower selling prices have offset higher borrowing costs. A mortgage pre-approval at today's rates is the first step.
Watch supply. New listings are down 11.9% from last year. If the seasonally adjusted rebound continues, the best-priced homes may not wait for spring.
See new listings first. Sign up for free listing alerts and I will send you matches as they come on.
What it means for sellers
Competition is thinner than last year. Active listings are down 10.0% and new listings are down 11.9%, so a well-priced, well-presented home stands out.
Price to today's comps. The MLS® HPI Composite is down 4.3% year over year, and apartments and townhouses are down the most. Detached and semi-detached homes in Toronto and Halton have held value best.
Know the local picture. Months of inventory range from 3.0 in Whitby to 11.1 in King, so the right strategy depends on your municipality and home type.
Know your number first. Start with a free home valuation and I will walk you through what comparable homes sold for near you.
Your next step: a free home valuation or listing alerts
Whether you are thinking about selling, buying or just keeping an eye on the market, here are two easy ways to start. Both are free and there is no obligation:
My online valuation and listing alert tools are built around Simcoe County and the surrounding area. If you have a question about a property elsewhere in the GTA, call or text me at 647-371-5335 or email darren@cabralrealestate.ca and I will help you directly.
Prefer to read about the local market closer to home? See my Simcoe County real estate market update for October 2026, covering Barrie, Innisfil, Bradford and Orillia.
Darren Cabral, REALTOR®
CV Real Estate, Brokerage
Photo credits
Cover: Sunset Toronto skyline from Snake Island by Jchmrt, CC BY-SA 4.0, via Wikimedia Commons.
All other photos are credited in the captions above. Photos come from Wikimedia Commons under their stated licences; charts are my own, built from TRREB data.
Sources
TRREB Market Watch, October 2026 (released November 4, 2026): GTA headline figures and year-over-year summary (p. 1), the home-type tables, regional tables and the MLS® Home Price Index (pp. 3 and 25).
TRREB Market Watch, October 2025: regional year-ago comparisons, as originally published.
TRREB Market Watch, September 2026: month-over-month comparisons and September HPI.
Notes: GTA-wide year-over-year changes marked (TRREB) are TRREB's own comparisons from the October 2026 report, which uses a revised October 2025 base (6,083 sales and a $1,052,539 average price). Regional year-over-year changes, the 905 roll-up and the month-over-month percentages are my own calculations from the as-published Market Watch tables, so they can differ slightly from a revised base. TRREB's "Townhouse" headline category includes condo townhouses, while the regional tables show attached/row homes separately. Dufferin and several Simcoe home-type samples are small. Statistics are for general information and are not an appraisal of any individual property.
Comments